National bicycle transport analysis tool released
4 November 2020 | Announcement

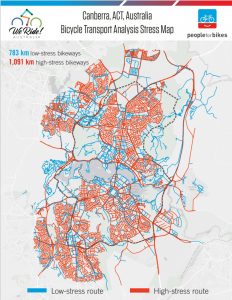
In an Australian first, We Ride Australia has applied a new tool to score every Australian capital on the ability to travel by bicycle between key local destinations.
The Bicycle Transport Analysis (BTA) project was developed by We Ride’s partners in the USA and uses open source, publicly available data. More than 650 North American, European and Australian cities have now been scored.
The BTA project was led in Australia by We Ride’s Executive Officer, Peter Bourke.
“We are very pleased how the BTA tool uses open source to evaluate the level of stress across a local government area or city jurisdiction,
 “Recent changes made as part of COVID measures in cities have resulted in immediate improvements of up to 10% in Sydney’s case with just 6 new strategically located bike lanes,” said Peter Bourke.
“The Bicycle Transport Analysis allows every Council to analyse their local community networks and create stress maps that help pinpoint where and how they can invest to make riding easier, more convenient and safer,
“Our objective is to enable cities and towns of all sizes to carry out a BTA and encourage them to build connected, safe bicycle networks that we know encourage more short daily trips by bicycle,” said Bourke.
“This has never been more important as many Australians have chosen to ride a bike during the COVID-19 pandemic because they felt safer with so little traffic on the roads.”
“Also, as we invest in COVID recovery we mustn’t forget that people arriving at local shops by cycling and walking spend more[1] and more local jobs are created[2] building bikeways than roads for the same amount of money,” said Mr Bourke.
The Bicycle Transport Analysis will be extended in 2021 and Local Governments wishing to participate in the program should contact We Ride Australia.
Cities overview:
The analysis has revealed a range of scores across Australia, from Hobart with 28 to Canberra with 61.
- CANBERRA – 61
- MELBOURNE – 45
- SYDNEY – 43
- PERTH – 42
- BRISBANE – 40
- ADELAIDE – 39
- DARWIN – 34
- HOBART – 28
Further information:
- The BTA’s utilise open source data, including the Australian Census and OpenStreetMaps (OSM), Qgis along with GIS data made available by cites and Councils.
- The full range of 8 city maps with the state and territory media statements and breakdown of the scoring can be seen at www.weride.org.au/bta
- International city scores can be seen at https://bna.peopleforbikes.org/#/
[1] For a summary of the evidence, Sustrans, 2019. Accessed 3.11.20: https://www.sustrans.org.uk/media/5224/common-misconceptions-of-active-travel-investment.pdf
[2] Mining Recovery Act Data for Opportunities to Improve the State of Practice for Overall Economic Impact Analysis of Transportation Investments. 2012, AASHTO, Accessed 3.11.20: http://onlinepubs.trb.org/onlinepubs/nchrp/docs/NCHRP08-36%28103%29_FR.pdf
Supported by Trek Bicycle Australia